Line Chart
Zero configuration • Built for industrial dashboards
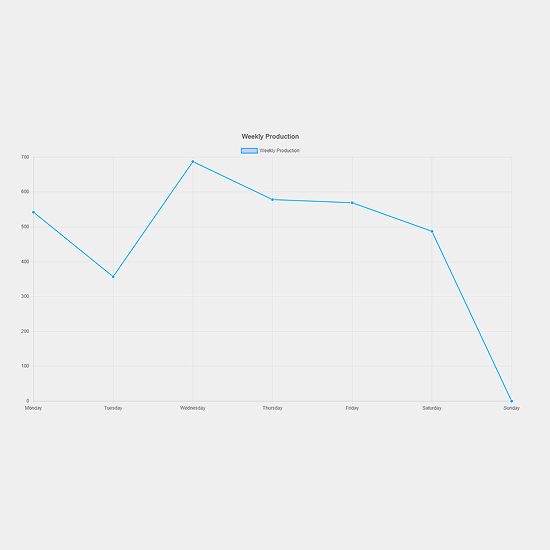
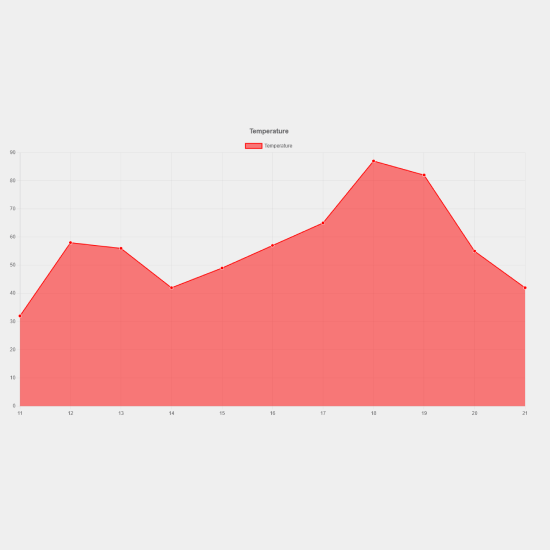
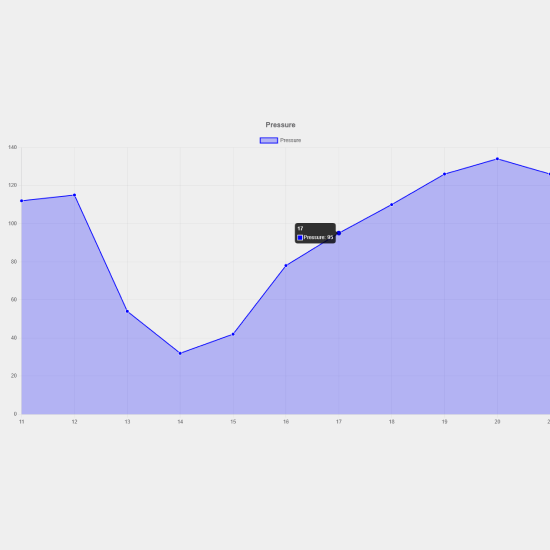
High-performance line chart for visualizing trend data.
Compatibility
- Unified PC Runtime
- Unified Comfort Panels
Use cases
- Trend Analysis
- Historical Data Review
- Process Monitoring
What's included?
- Unlimited Usage
- Email Support
- Lifetime Updates
Documentation
Line Chart
A high-performance line chart component for WinCC Unified that displays data as connected points along a continuous line. Perfect for visualizing trends, time-series data, and continuous process variables in industrial automation and SCADA applications.
Overview
The Line Chart component provides smooth, real-time trend visualization with optional area fill capability. Built on Chart.js, it integrates seamlessly with WinCC Unified runtime to display process data, historical trends, and dynamic measurements with professional styling and responsive performance.
Component Type
Data Visualization Control / Trend Display
Properties
Title
- Type:
string - Category: Appearance
- Description: The text displayed at the top of the chart
- Usage: Set this property to identify the trend or data series being visualized
- Default:
"Line Chart" - Example:
"Temperature Trend","Production Rate Over Time","Pressure History"
Data
- Type:
Array<DataPoint> - Category: Data
- Description: Array of numeric data points to be plotted as connected line segments
- Usage: Bind this property to time-series data from PLC tags, historian, or calculated values
- Structure: Each data point is an object with a
Valueproperty[ { "Value": 65 }, { "Value": 59 }, { "Value": 80 } ] - Default: Seven sample data points (65, 59, 80, 81, 56, 55, 40)
- Validation: Values must be numeric. Array length should match Labels array length
- Note: Data updates trigger smooth chart transitions with animation
- Performance: Optimized for up to 100 data points with good performance
Labels
- Type:
Array<Label> - Category: Data
- Description: Array of text labels for the x-axis corresponding to each data point
- Usage: Define timestamps, time intervals, or sequential markers for trend data
- Structure: Each label is an object with a
Textproperty[ { "Text": "10:00" }, { "Text": "10:05" }, { "Text": "10:10" } ] - Default: Days of the week (Mon, Tue, Wed, Thu, Fri, Sat, Sun)
- Validation: Array length should match Data array length for proper alignment
- Example: Time stamps
["10:00", "10:05", "10:10"], Intervals["T0", "T1", "T2"] - Best Practice: For time-series data, use consistent time intervals for accurate trend representation
LineColor
- Type:
Color(number) - Category: Appearance
- Description: Color of the line connecting data points
- Usage: Set to distinguish different trends or match process color coding standards
- Default:
4278233343(blue: RGB 45, 99, 255) - Format: WinCC Unified ARGB color value as 32-bit integer
- Example Values:
4278190335- Red for alarm conditions4278255360- Green for normal operation4294944000- Orange for warning states
- Note: Line width is automatically adjusted for optimal visibility
ForegroundColor
- Type:
Color(number) - Category: Appearance
- Description: Color used for chart title, axis labels, legend text, and grid lines
- Usage: Set to ensure text and grid readability against the chart background
- Default:
4294967295(white: RGB 255, 255, 255) - Format: WinCC Unified ARGB color value as 32-bit integer
- Best Practice: Use high contrast with ChartBackgroundColor for operator visibility
ChartBackgroundColor
- Type:
Color(number) - Category: Appearance
- Description: Background color for the entire chart area
- Usage: Match the chart background to your HMI screen design and color scheme
- Default:
4280361249(dark gray: RGB 33, 37, 41) - Format: WinCC Unified ARGB color value as 32-bit integer
- Note: This color fills the canvas behind the line, grid, and labels
ShowFill
- Type:
boolean - Category: Appearance
- Description: Enables or disables the colored area fill beneath the line
- Usage: Enable to create an area chart effect for better visual emphasis of trends
- Default:
false - Values:
true- Display filled area under the line with FillColorfalse- Display only the line without fill
- Use Cases:
- Enable for cumulative data visualization
- Enable to highlight trend magnitude
- Disable for cleaner, minimal trend display
- Note: When enabled, FillColor property determines the fill appearance
FillColor
- Type:
Color(number) - Category: Appearance
- Description: Color of the filled area beneath the line when ShowFill is enabled
- Usage: Set to create visual depth while maintaining line visibility
- Default:
671088895(semi-transparent blue: ARGB 40, 0, 0, 255) - Format: WinCC Unified ARGB color value with alpha channel for transparency
- Best Practice: Use semi-transparent colors (alpha < 200) to maintain grid visibility
- Example Values:
671088895- Translucent blue (default)1073741824- 25% opacity white overlay2147483648- 50% opacity black overlay
- Note: Only visible when ShowFill is set to true
Data Structure Details
DataPoint Object
{
  "Value": 0
}- Value: Numeric value representing the y-axis position
- Type:
number - Default:
0 - Accepts positive and negative values
- Supports floating-point precision
- Automatically scaled to fit chart bounds
- Type:
Label Object
{
  "Text": ""
}- Text: String displayed on the x-axis
- Type:
string - Default:
""(empty string) - Supports timestamps, sequential numbers, or descriptive text
- Automatically rotated for space optimization
- Truncated with ellipsis if too long
- Type:
Usage Examples
Basic Trend Visualization
// Set chart title
Title = "Process Temperature"

// Configure data points
Data = [
  { Value: 72.5 },
  { Value: 73.2 },
  { Value: 74.1 },
  { Value: 73.8 },
  { Value: 72.9 }
]

// Set time-based labels
Labels = [
  { Text: "08:00" },
  { Text: "09:00" },
  { Text: "10:00" },
  { Text: "11:00" },
  { Text: "12:00" }
]

// Configure appearance
LineColor = 4278255360  // Green for normal operation
ShowFill = false
Area Chart with Fill
// Production volume visualization
Title = "Daily Production Volume"

Data = [
  { Value: 1250 },
  { Value: 1340 },
  { Value: 1420 },
  { Value: 1380 },
  { Value: 1500 }
]

Labels = [
  { Text: "Mon" },
  { Text: "Tue" },
  { Text: "Wed" },
  { Text: "Thu" },
  { Text: "Fri" }
]

// Enable area fill
ShowFill = true
FillColor = 1090519039  // Semi-transparent green (ARGB 65, 0, 255, 0)
LineColor = 4278255360  // Solid green line
Dynamic Data Binding
// Real-time process monitoring
Data[0].Value = "PLC_1"."TankLevel_T1"
Data[1].Value = "PLC_1"."TankLevel_T2"
Data[2].Value = "PLC_1"."TankLevel_T3"

// Dynamic color based on alarm state
LineColor = (:HighAlarm:) ? 4294901760 : 4278233343

// Show fill when in warning state
ShowFill = (:WarningState:)
Historical Trend Display
// 24-hour trend with hourly data points
Title = "24-Hour Temperature History"

// Bind to historian array
Data = (:HistoricalData:)
Labels = (:TimeStampLabels:)

// Styling for historical review
ChartBackgroundColor = 4278190080  // Black background
ForegroundColor = 4294967295      // White text
LineColor = 4294944000            // Orange line
ShowFill = true
FillColor = 1107296255            // Transparent orange (ARGB 66, 255, 128, 0)
Multi-Point Rolling Trend
// Sliding window of last 50 measurements
Title = "Rolling Pressure Trend (50 samples)"

// Update via script to maintain fixed window size
// In update script:
// Data.shift()  // Remove oldest
// Data.push({ Value: newValue })  // Add newest
Color Format Reference
WinCC Unified uses 32-bit ARGB color values:
- Format:
0xAARRGGBB - A: Alpha (transparency) -
00(transparent) toFF(opaque) - R: Red component -
00toFF - G: Green component -
00toFF - B: Blue component -
00toFF
Conversion Formula:
DecimalValue = (A * 16777216) + (R * 65536) + (G * 256) + B
Common Solid Colors:
- Black:
4278190080(0xFF000000) - White:
4294967295(0xFFFFFFFF) - Red:
4294901760(0xFFFF0000) - Green:
4278255360(0xFF00FF00) - Blue:
4278190335(0xFF0000FF) - Orange:
4294944000(0xFFFFA500)
Semi-Transparent Colors for Fills:
- 25% Blue:
671088895(0x28000FF) - 50% Red:
2147483648(0x80FF0000) - 40% Green:
1090519039(0x4100FF00)
Best Practices
-
Data Management
- Keep Data and Labels arrays synchronized in length
- For time-series trends, maintain consistent time intervals
- Limit visible data points to 100 for optimal performance
- Consider implementing rolling window for continuous trends
-
Color Selection
- Use LineColor that contrasts well with ChartBackgroundColor
- For ShowFill, use semi-transparent FillColor (alpha 40-100)
- Match LineColor to process status (green=normal, red=alarm, orange=warning)
- Ensure ForegroundColor provides readable text and grid lines
-
Performance Optimization
- Update Data at reasonable intervals (100-500ms minimum)
- Use change-on-change triggers rather than cyclic updates
- Avoid updating individual array elements; replace entire array
- Consider data decimation for high-frequency source data
-
Trend Visualization
- Set meaningful Title that identifies the process variable
- Use ShowFill to emphasize cumulative or volume data
- Keep Labels concise for time-series data (HH:MM format)
- Ensure y-axis range accommodates expected data values
-
User Experience
- Provide consistent color coding across related charts
- Use high contrast colors for critical process variables
- Consider dark backgrounds (ChartBackgroundColor) to reduce operator eye strain
- Ensure chart updates smoothly without flickering
Integration with WinCC Unified
Runtime Behavior
- Component initializes on screen load with configured or default values
- Property changes trigger smooth chart transitions with animation
- WebCC API manages bidirectional communication with WinCC runtime
- Chart automatically rescales y-axis based on data range
- Line rendering uses anti-aliasing for smooth appearance
Data Binding
- Static Configuration: Set Data and Labels directly in properties
- Tag Binding: Bind individual Data[n].Value to PLC tags
- Array Binding: Bind entire Data array to structured tag arrays
- Scripting: Update properties via screen scripts for complex logic
Supported Platforms
- Unified PC Runtime: Full support with hardware-accelerated rendering
- Unified Comfort Panels: Optimized for embedded systems with touch support
- Browser Runtime: Compatible with WebView-based clients
Performance Characteristics
- Rendering: Canvas-based with Chart.js optimization
- Update Rate: Supports refresh rates of 2-10 Hz (100-500ms intervals)
- Animation: Smooth transitions for data updates
- Memory: Efficient memory usage suitable for multi-chart displays
Related Components
- Bar Chart: For discrete categorical data comparison
- Gauge: For single-value process monitoring with thresholds
- Table: For detailed numeric data with timestamps
Technical Notes
- Component uses Chart.js library version 3.x for rendering
- WebCC.js API provides WinCC Unified custom control integration
- Property changes use WebCC.onPropertyChanged event subscription
- Default values ensure component renders correctly without configuration
- Line tension set to 0.4 for smooth, natural curves
- Animation duration: 300ms for responsive feel
Advanced Configuration
Creating Multi-Series Trends
While this component displays single-series data, multiple Line Chart instances can be overlaid:
// Chart 1: Temperature
LineChart1.Title = "Process Variables"
LineChart1.LineColor = 4294901760  // Red

// Chart 2: Pressure (position on top)
LineChart2.ChartBackgroundColor = 0  // Transparent
LineChart2.LineColor = 4278190335    // Blue
Implementing Alarm Thresholds
Use scripting to change appearance based on threshold violations:
// In screen script
if (CurrentValue > HighLimit) {
  LineChart1.LineColor = 4294901760;  // Red
  LineChart1.ShowFill = true;
} else if (CurrentValue > WarningLimit) {
  LineChart1.LineColor = 4294944000;  // Orange
  LineChart1.ShowFill = false;
} else {
  LineChart1.LineColor = 4278255360;  // Green
  LineChart1.ShowFill = false;
}
Troubleshooting
Chart not displaying data:
- Verify Data array structure matches expected DataPoint format
- Check that Data and Labels arrays have equal length
- Ensure numeric values are valid (not NaN, null, or Infinity)
- Confirm component is visible and has non-zero size
Line appears jagged or pixelated:
- Increase component size for better resolution
- Check ChartBackgroundColor is not interfering with line rendering
- Verify LineColor has full opacity (alpha = FF)
Fill not visible when ShowFill is true:
- Confirm FillColor has sufficient alpha value (recommend > 40)
- Ensure FillColor differs from ChartBackgroundColor
- Check that ShowFill property is successfully bound/updated
Performance issues with updates:
- Reduce update frequency (minimum 100ms intervals)
- Limit data points to 50-100 for real-time trends
- Use data decimation for high-frequency source data
- Avoid updating during screen transitions
Colors not displaying correctly:
- Verify color values are valid 32-bit signed integers
- Check alpha channel (first 2 hex digits) for transparency
- Ensure color format matches WinCC Unified ARGB standard
- Test with known reference colors (white: 4294967295, black: 4278190080)
On this page
- Overview
- Component Type
- Properties
- Title
- Data
- Labels
- LineColor
- ForegroundColor
- ChartBackgroundColor
- ShowFill
- FillColor
- Data Structure Details
- DataPoint Object
- Label Object
- Usage Examples
- Basic Trend Visualization
- Area Chart with Fill
- Dynamic Data Binding
- Historical Trend Display
- Multi-Point Rolling Trend
- Color Format Reference
- Best Practices
- Integration with WinCC Unified
- Runtime Behavior
- Data Binding
- Supported Platforms
- Performance Characteristics
- Related Components
- Technical Notes
- Advanced Configuration
- Creating Multi-Series Trends
- Implementing Alarm Thresholds
- Troubleshooting