Dashboard Kit
Zero configuration • Built for industrial dashboards
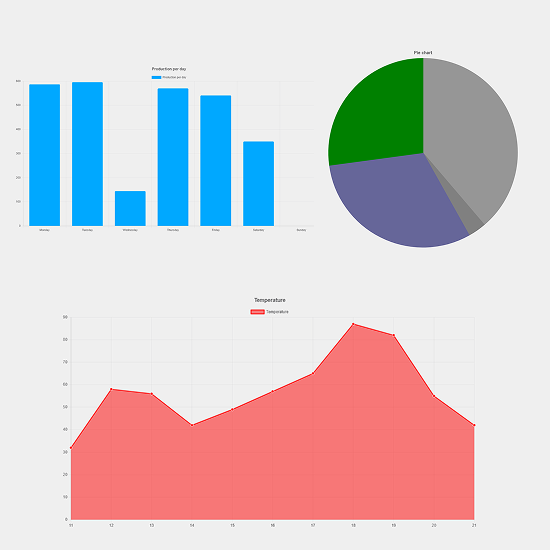
Complete data visualization bundle containing Line, Bar, and Pie/Doughnut charts for professional WinCC Unified dashboards.
Compatibility
- Unified PC Runtime
- Unified Comfort Panels
Use cases
- Comprehensive Process Monitoring
- Production Management Dashboards
- Industrial Data Analytics
- Energy Management Systems
What's included?
- Line Chart Component
- Bar Chart Component
- Pie/Doughnut Chart Component
- Unlimited Usage
- Email Support
- Lifetime Updates
Documentation
Dashboard Kit
The Dashboard Kit is the ultimate visualization package for WinCC Unified developers. This comprehensive bundle brings together our three most powerful charting components—Line Chart, Bar Chart, and Pie/Doughnut Chart—providing everything you need to build professional, high-performance industrial dashboards.
By combining these essential visualization tools, the Dashboard Kit enables you to represent any type of process data, from real-time trends and historical comparisons to proportional distributions and KPIs.
Included Components
1. Line Chart
Perfect for continuous data visualization and trend analysis.
- Real-time process value tracking
- Historical data visualization
- Smooth animations and high-performance rendering
- Fully customizable axis and grid colors
2. Bar Chart
Ideal for comparing discrete data points and tracking metrics over time.
- Categorical data comparison
- Production output tracking
- Shift-based performance analysis
- Dynamic color coding based on status or alarms
3. Pie/Doughnut Chart
Professional circular charts for visualizing proportional data distribution.
- Proportional resource allocation
- Production mix monitoring
- KPI visualization with center text in doughnut mode
- Automatic percentage calculation and display
Key Benefits
- Significant Savings: Get all three essential charts at a discounted bundle price compared to individual purchases.
- Unified Design: All components share a consistent design language and configuration pattern, ensuring a cohesive look for your HMI.
- Seamless Integration: Built specifically for WinCC Unified (PC Runtime and Comfort Panels) using the WebCC API.
- Performance Optimized: Each component is engineered for industrial environments where reliability and responsiveness are critical.
- Future-Proof: Includes lifetime updates for all components in the bundle.
Implementation Guide
The Dashboard Kit components follow a consistent implementation pattern in WinCC Unified. For detailed documentation on each component, please refer to their individual documentation pages.
General Configuration Pattern
- Drop the Component: Drag the desired chart from your library onto a WinCC Unified screen.
- Configure Basic Properties: Set Title, Colors, and Background styles in the property inspector.
- Bind Data via Scripts: Use WinCC Unified screen scripts to update the component's data and labels arrays from your PLC tags or historical logs.
Example: Multi-Chart Dashboard
A typical production dashboard might utilize all three components:
- Bar Chart: To show total production output per shift.
- Line Chart: To monitor real-time temperature or pressure trends.
- Pie Chart: To visualize the ratio of "Good" vs. "Scrap" parts produced.
Technical Specifications
- Compatibility: WinCC Unified V17, V18, V19
- Runtime: PC Runtime, Comfort Panels, Unified Unified Runtime on S7-1500 (Web Server)
- Technology: HTML5, CSS3, JavaScript (Chart.js)
- Communication: Bidirectional WebCC API
Support
The Dashboard Kit includes premium email support to help you integrate these components into your specific industrial applications. Whether you need help with script-based data binding or visual customization, our team is here to assist.