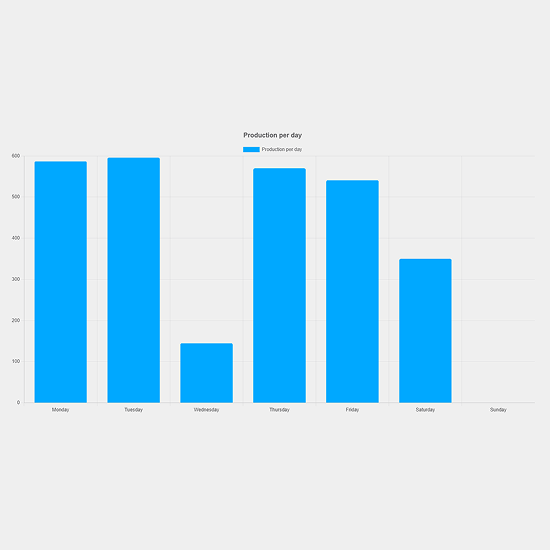
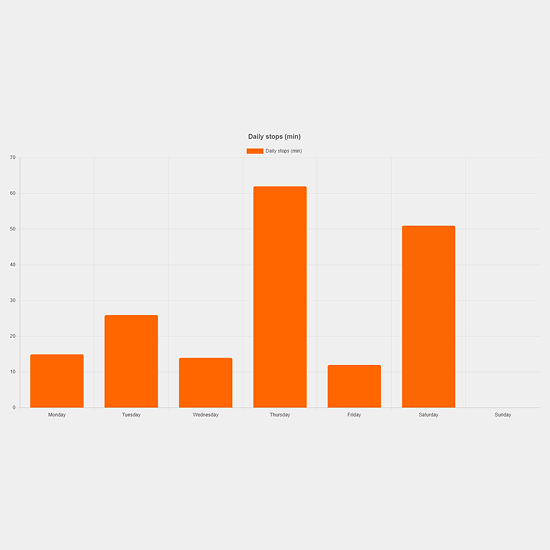
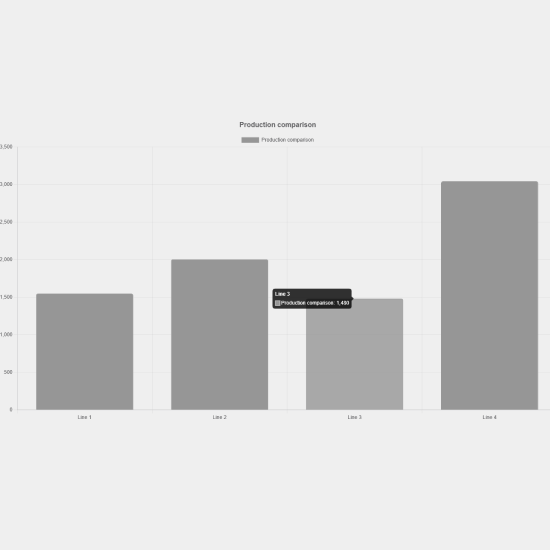
Bar Chart
Zero configuration • Built for industrial dashboards
High-performance bar chart for visualizing trend data.
Compatibility
- Unified PC Runtime
- Unified Comfort Panels
Use cases
- Trend Analysis
- Historical Data Review
- Process Monitoring
What's included?
- Unlimited Usage
- Email Support
- Lifetime Updates
Documentation
Bar Chart
A high-performance bar chart component for WinCC Unified that provides visual representation of data using vertical bars. Ideal for comparing discrete data points, tracking metrics over time, and displaying categorical data in industrial SCADA applications.
Overview
The Bar Chart component integrates seamlessly with WinCC Unified runtime, providing real-time data visualization with customizable appearance. Built using Chart.js, it offers smooth animations, responsive rendering, and efficient performance for HMI applications.
Component Type
Data Visualization Control
Properties
Title
- Type:
string - Category: Appearance
- Description: The text displayed at the top of the chart
- Usage: Set this property to provide context for the data being visualized
- Default:
"Bar Chart" - Example:
"Daily Production Output","Temperature Readings"
Data
- Type:
Array<DataPoint> - Category: Data
- Description: Array of numeric data points to be displayed as bars
- Usage: Bind this property to a WinCC tag or array to display real-time process values
- Structure: Each data point is an object with a
Valueproperty[ { "Value": 65 }, { "Value": 59 }, { "Value": 80 } ] - Default: Seven sample data points (65, 59, 80, 81, 56, 55, 40)
- Validation: Values must be numeric. Array length should match Labels array length
- Note: Data updates trigger automatic chart re-rendering
Labels
- Type:
Array<Label> - Category: Data
- Description: Array of text labels for the x-axis corresponding to each bar
- Usage: Define categories or time periods for each data point
- Structure: Each label is an object with a
Textproperty[ { "Text": "Mon" }, { "Text": "Tue" }, { "Text": "Wed" } ] - Default: Days of the week (Mon, Tue, Wed, Thu, Fri, Sat, Sun)
- Validation: Array length should match Data array length for proper alignment
- Example:
["Shift 1", "Shift 2", "Shift 3"],["Q1", "Q2", "Q3", "Q4"]
BarColor
- Type:
Color(number) - Category: Appearance
- Description: Fill color for all bars in the chart
- Usage: Set to match your plant's color scheme or indicate status (green for normal, red for alarm)
- Default:
4278233343(blue: RGB 45, 99, 255) - Format: WinCC Unified ARGB color value as 32-bit integer
- Example Values:
4278190335- Red (RGB 255, 0, 0)4278255360- Green (RGB 0, 255, 0)4294967295- White (RGB 255, 255, 255)
- Note: Color value includes alpha channel for transparency control
ForegroundColor
- Type:
Color(number) - Category: Appearance
- Description: Color used for chart title, axis labels, legend text, and grid lines
- Usage: Set to ensure text readability against the chart background
- Default:
4294967295(white: RGB 255, 255, 255) - Format: WinCC Unified ARGB color value as 32-bit integer
- Best Practice: Use high contrast with ChartBackgroundColor for optimal visibility
ChartBackgroundColor
- Type:
Color(number) - Category: Appearance
- Description: Background color for the entire chart area
- Usage: Match the chart background to your HMI screen design
- Default:
4280361249(dark gray: RGB 33, 37, 41) - Format: WinCC Unified ARGB color value as 32-bit integer
- Note: This color fills the canvas behind bars, grid, and labels
Data Structure Details
DataPoint Object
{
  "Value": 0
}- Value: Numeric value representing the bar height
- Type:
number - Default:
0 - Accepts positive and negative values
- Displayed with automatic scale adjustment
- Type:
Label Object
{
  "Text": ""
}- Text: String displayed on the x-axis
- Type:
string - Default:
""(empty string) - Supports special characters and Unicode
- Automatically wraps for long text
- Type:
Usage Examples
Basic Configuration
// Set chart title
Title = "Production Output"

// Configure data points
Data = [
  { Value: 120 },
  { Value: 145 },
  { Value: 98 },
  { Value: 167 },
  { Value: 132 }
]

// Set labels
Labels = [
  { Text: "Line 1" },
  { Text: "Line 2" },
  { Text: "Line 3" },
  { Text: "Line 4" },
  { Text: "Line 5" }
]
Dynamic Data Binding
// Bind to PLC tags for real-time updates
Data[0].Value = "PLC_1"."ProductionLine1"
Data[1].Value = "PLC_1"."ProductionLine2"
Data[2].Value = "PLC_1"."ProductionLine3"

// Update colors based on alarm status
BarColor = (:SystemAlarm:) ? 4278190335 : 4278233343
Time-Series Visualization
// Hourly production tracking
Title = "Hourly Production Rate"

Labels = [
  { Text: "08:00" },
  { Text: "09:00" },
  { Text: "10:00" },
  { Text: "11:00" },
  { Text: "12:00" }
]

Data = (:HourlyDataArray:)  // Bind to array tag
Color Format Reference
WinCC Unified uses 32-bit ARGB color values:
- Format:
0xAARRGGBB - A: Alpha (transparency) -
00toFF - R: Red component -
00toFF - G: Green component -
00toFF - B: Blue component -
00toFF
Conversion Formula:
DecimalValue = (A * 256³) + (R * 256²) + (G * 256) + B
Common Colors:
- Black:
4278190080(0xFF000000) - White:
4294967295(0xFFFFFFFF) - Red:
4294901760(0xFFFF0000) - Green:
4278255360(0xFF00FF00) - Blue:
4278190335(0xFF0000FF)
Best Practices
-
Data Array Management
- Keep Data and Labels arrays synchronized in length
- Limit data points to 20-30 for optimal readability
- Use meaningful, concise labels (3-10 characters)
-
Color Selection
- Ensure sufficient contrast between BarColor and ChartBackgroundColor
- Use consistent colors across HMI screens for similar data types
- Consider color-blind friendly palettes for accessibility
-
Performance Optimization
- Update Data property at reasonable intervals (not faster than 100ms)
- Avoid binding individual array elements; update entire array at once
- Use change-on-change triggers rather than continuous updates
-
Visual Design
- Set ForegroundColor for good text readability
- Match ChartBackgroundColor to screen background for seamless integration
- Use Title property to clearly identify the data being displayed
-
Data Validation
- Validate data ranges before binding to prevent display issues
- Handle null or undefined values in your scripting logic
- Consider min/max bounds for industrial process values
Integration with WinCC Unified
Runtime Behavior
- Component initializes on screen load with default or configured values
- Property changes trigger immediate visual updates
- WebCC API handles bidirectional communication with WinCC runtime
- Chart automatically rescales when data values change
Supported Platforms
- Unified PC Runtime: Full support with hardware acceleration
- Unified Comfort Panels: Optimized for touch interaction and lower resource environments
Performance Characteristics
- Rendering: Canvas-based for smooth animations
- Update Rate: Supports refresh rates up to 10 Hz (100ms intervals)
- Memory: Lightweight footprint suitable for multi-screen HMI applications
Related Components
- Line Chart: For continuous trend visualization
- Gauge: For single-value displays with thresholds
- Table: For detailed numeric data presentation
Technical Notes
- Component uses Chart.js library for rendering
- WebCC.js API provides WinCC Unified integration
- Property updates use observer pattern for efficient rendering
- Default values ensure component displays correctly even without configuration
Troubleshooting
Chart not displaying data:
- Verify Data array structure matches expected format
- Check that array lengths for Data and Labels are equal
- Ensure numeric values are valid (not NaN or Infinity)
Colors not appearing correctly:
- Confirm color values are valid 32-bit integers
- Check alpha channel is set to FF for full opacity
- Verify no transparency issues with background
Performance issues:
- Reduce update frequency if data changes rapidly
- Limit number of data points displayed
- Check for script errors in browser console
On this page
- Overview
- Component Type
- Properties
- Title
- Data
- Labels
- BarColor
- ForegroundColor
- ChartBackgroundColor
- Data Structure Details
- DataPoint Object
- Label Object
- Usage Examples
- Basic Configuration
- Dynamic Data Binding
- Time-Series Visualization
- Color Format Reference
- Best Practices
- Integration with WinCC Unified
- Runtime Behavior
- Supported Platforms
- Performance Characteristics
- Related Components
- Technical Notes
- Troubleshooting